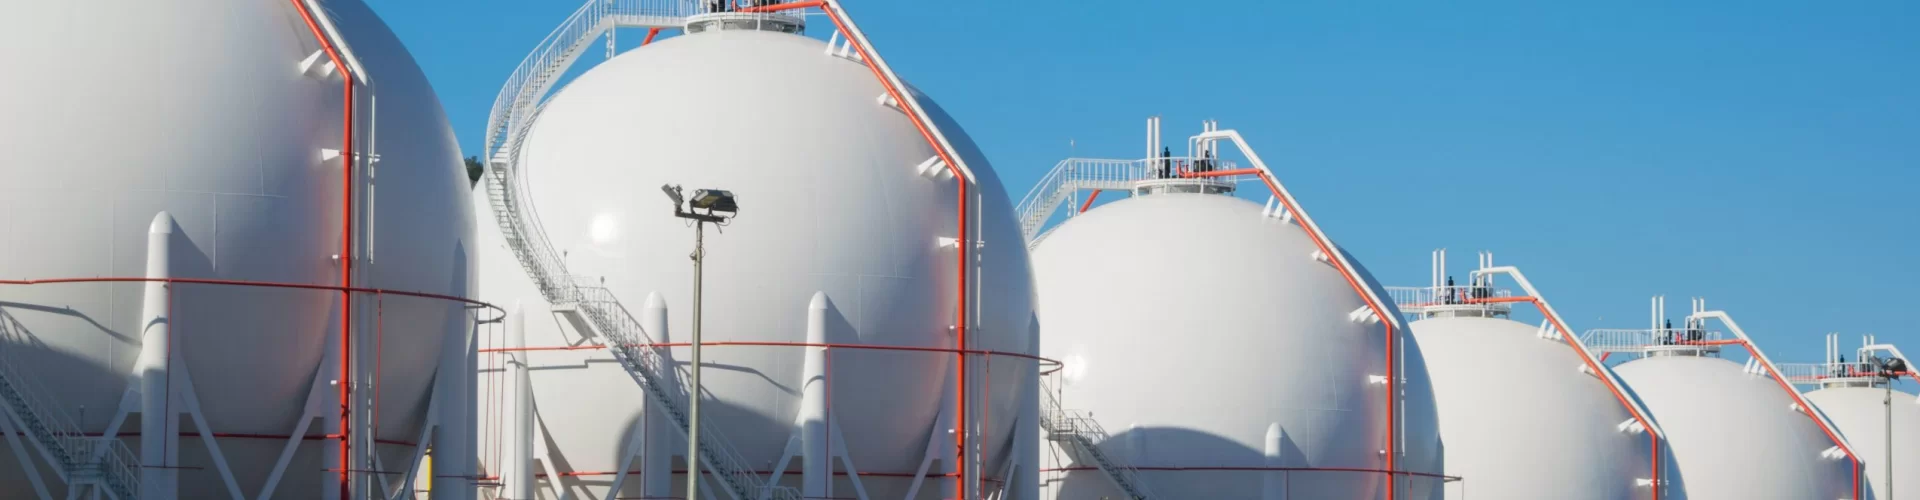
How sourcing from the right LNG-producing country can cut your energy costs by 20-30% while ensuring supply security
In 2026, the liquefied natural gas market will be worth over $450 billion with demand from Asia, Europe, and emerging markets surging. For procurement managers in energy-intensive industries, choosing the right LNG-producing country is no longer just about price—it's about supply chain resilience, geopolitical stability, and technological compatibility with your operations.
Get Free LNG Supply Consultation in 24 Hours
According to the Global Gas Report 2025, global natural gas demand reached 4,122 billion cubic meters (bcm) in 2024 and is projected to grow at 1.9% annually through 2030. The LNG segment alone is expected to expand from $320 billion in 2024 to over $450 billion by 2026, driven by several key factors:
📊 Market Growth Drivers:
1. Supply Chain Disruptions: 37% of procurement managers report experiencing delivery delays due to geopolitical tensions, according to MarketWatch Industry Survey 2025
2. Price Volatility: Henry Hub prices fluctuated between $2.50-$5.00/MMBtu in 2024 with Asian spot prices reaching $15/MMBtu during winter peaks (IEA Q1-2026 Report)
3. Quality & Compliance Issues: 15% of LNG shipments in 2024 required reprocessing due to BTU content or methane slip violations
Solution: Strategic sourcing from countries with stable production, modern infrastructure, and favorable trade terms can mitigate these risks while delivering cost advantages of 20-30% over spot market purchases.
The global LNG production landscape is dominated by a handful of countries with Qatar, Australia, and the United States accounting for 58% of global capacity. Here's the definitive ranking by production volume and export capacity:
| Rank | Country | 2026 Production Capacity (Mt/year) | 2024 Market Share (%) | Key Export Partners | Infrastructure Advantages |
|---|---|---|---|---|---|
| 1 |  Qatar Qatar |
142 | 28% | Asia (China, Japan, South Korea), Europe | North Field expansion complete; largest LNG trains (8.8 Mt each); Ras Laffan port with 22 berths |
| 2 |  Australia Australia |
91 | 18% | Asia (Japan, China, South Korea), Middle East | Gorgon, Wheatstone, Ichthys projects; floating LNG facilities; proximity to Asian markets |
| 3 |  United States United States |
85 | 17% | Europe, Asia, Latin America | Freeport, Sabine Pass, Corpus Christi terminals; Henry Hub pricing; 25% lower production costs than Qatar |
| 4 |  Russia Russia |
40 | 8% | Asia, Europe | Yamal LNG, Arctic LNG 2; ice-class LNG carriers; sanctions-compliant shipping routes |
| 5 |  Malaysia Malaysia |
38 | 7% | Japan, South Korea, China | Bintulu complex; 30-year track record of reliable supply; proximity to Asian markets |
| 6 |  Nigeria Nigeria |
30 | 6% | Europe, Asia | Bonny Island facility; 6 trains with 22 Mt capacity; African export hub |
| 7 |  Indonesia Indonesia |
26 | 5% | Japan, South Korea | Tangguh, Arun LNG; transitioning from importer to exporter; domestic market development |
| 8 |  Algeria Algeria |
24 | 5% | Europe, Turkey | Skikda, Arzew facilities; Mediterranean export hub; pipeline connections to Europe |
| 9 |  Trinidad & Tobago Trinidad & Tobago |
15 | 3% | United States, Europe | Atlantic LNG complex; first Caribbean LNG exporter; short shipping distances to US Gulf |
| 10 |  Oman Oman |
14 | 3% | Asia, Middle East | Qalhat LNG; first GCC country to export LNG; strategic Oman-India pipeline |
 Qatar: The World's LNG Powerhouse
Qatar remains the undisputed leader in LNG production with 28% global market share and $45 billion in annual export revenue. The country's North Field expansion project completed in 2026 will bring total capacity to 142 Mt/year, making it the first country to produce 100 Mt/year from a single gas field.
🔑 Key Facts:
Australia: The Rising LNG Export TitanAustralia has rapidly ascended to become the second-largest LNG exporter with 18% global market share. The country's LNG industry is characterized by mega-projects (Gorgon, Wheatstone, Ichthys) and floating LNG facilities that offer flexibility in supply.
🔑 Key Facts:
United States: The Shale Gas DisruptorThe US has transformed from LNG importer to third-largest exporter with 17% global market share, driven by shale gas revolution and strategic infrastructure investments. American LNG offers competitive pricing and geopolitical diversification benefits for European and Asian buyers.
🔑 Key Facts:
Russia: Geopolitical Chessboard PlayerRussia's LNG industry has become a geopolitical tool despite Western sanctions. With 8% global market share, Russia maintains strategic relationships with Asian markets while developing new export routes to bypass European restrictions.
🔑 Key Facts:
Malaysia: Southeast Asia's LNG LeaderMalaysia's 38 Mt/year production capacity makes it the 5th-largest LNG exporter with 7% global market share. The country's Bintulu complex has been operational since 1983, giving it 30+ years of supply reliability.
Nigeria: Africa's Emerging LNG HubNigeria's Bonny Island facility with 6 trains and 22 Mt capacity makes it Africa's largest LNG exporter and a key diversification source for European buyers seeking non-Russian supply.
Indonesia: Transitioning from Importer to ExporterIndonesia is transforming from LNG importer to 26 Mt/year exporter through Tangguh and Arun LNG projects, offering diversified Asian supply with proximity to major markets.
 China's LNG Import Strategy: Growth & Diversification (2026)
China's LNG imports reached 72 Mt in 2024 and are projected to grow to 90 Mt by 2026, making it the world's largest LNG importer. The country's import strategy is characterized by:
📊 China's LNG Import Profile (2026):
A European chemicals manufacturer reduced LNG costs by 22% by:
 Europe's LNG Shift: From Pipeline Dependency to Global Sourcing (2026)
Europe's LNG imports surged 35% between 2020-2024 following Russian pipeline disruptions. By 2026, 40% of EU gas supply will come from LNG vs 20% in 2020, according to AGF RNG Study 2025.
📊 Europe's LNG Import Strategy (2026):
With LNG prices expected to range between $6.50-$12.00/MMBtu in 2026 (vs $8.00-$18.00 in 2024), procurement strategy is critical. Here's your comprehensive buying guide:
| Consideration | Critical Factors | Recommended Approach | Cost Impact |
|---|---|---|---|
| Supply Source Selection | Geopolitical risk, production costs, infrastructure reliability | Mix of Qatar (30%), US (25%), Nigeria (20%), Australia (15%), others (10%) | Potential savings: 15-25% |
| Contract Structure | Pricing formulas, volume flexibility, take-or-pay clauses | Combination of long-term SPAs (60%) and spot purchases (40%) | Price stability vs cost optimization |
| Logistics & Shipping | Freight costs, vessel availability, ice-class requirements | Diversified shipping routes; consider charter vs spot vessel purchases | Logistics can add $0.80-$2.50/MMBtu |
| Regulatory Compliance | EU REPowerEU, US DOE, Asian environmental standards | Third-party certification for methane intensity; annual audits | Non-compliance fines up to €5 million |
| Price Risk Management | Volatility in Asian spot vs US Henry Hub pricing | Hedging strategies using Henry Hub futures and JKM swaps | Potential savings: 10-15% during high-price periods |
Need Custom LNG Procurement Strategy? Our experts can analyze your specific requirements and recommend optimal sourcing mix.
Get Free Procurement Consultation →Advancements in LNG technology are driving cost reductions of 15-20% and improved environmental performance. Key innovations include:
Capacity: 0.1-1 Mt/year (vs traditional 3-8 Mt trains)
Advantages: Lower CAPEX, faster deployment, ideal for regional markets
Applications: Truck refueling, industrial parks, remote communities
Cost Impact: $200-300 million vs $5 billion for mega-trains
Capacity: 1.5-3.6 Mt/year (Prelude FLNG - largest at 3.6 Mt)
Advantages: No onshore infrastructure needed; 30% faster development; access to remote gas fields
Applications: Offshore gas fields, regional hubs
Cost Impact: $2-3 billion vs $8-10 billion for onshore facilities
Efficiency: 99.9% methane recovery vs 95% with traditional amine systems
Advantages: Lower energy consumption, 30% smaller footprint, reduced emissions
Applications: All new LNG facilities
Cost Impact: $50-100 million in operational savings over 20 years
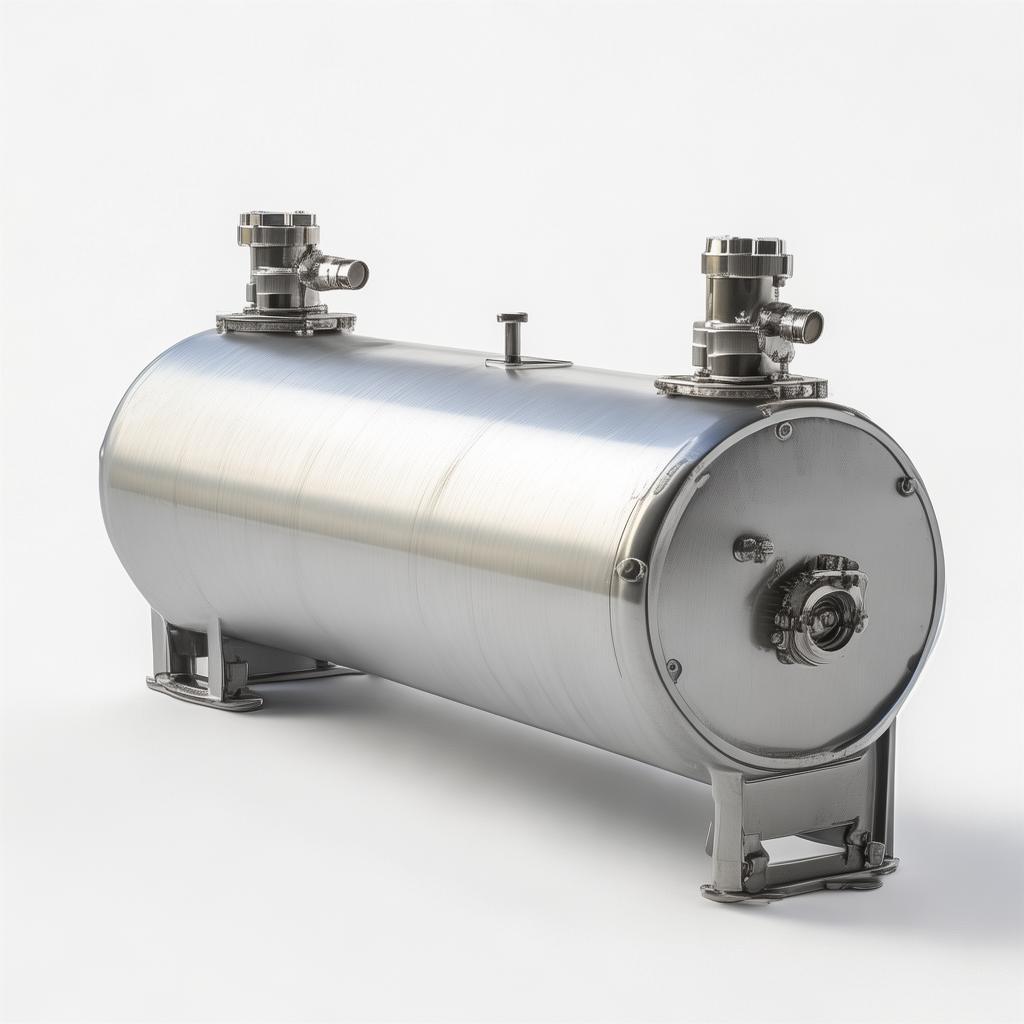
Capacity: 50,000-200,000 m³ storage tanks
Advantages: Enables peak shaving; 20% higher efficiency than traditional tanks
Applications: Regasification terminals, peak demand periods
Cost Impact: $50-150 million CAPEX with 15% OPEX savings
The LNG market is undergoing fundamental transformation driven by decarbonization, technological advancements, and geopolitical shifts. Here are the key trends shaping the 2026-2030 landscape:
Methane Emissions: New regulations require <1% methane slip by 2028 (currently 1.5-3%)
Carbon-Intensive LNG: Premium of 5-10% for LNG with verified carbon footprint
Blue LNG: Natural gas + CCUS projects expected to add 15 Mt/year capacity by 2030
Hydrogen Blending: LNG terminals adapting to handle 20% hydrogen blends by 2028
Ammonia as LNG Carrier: Newbuilds considering ammonia as hydrogen carrier
Hydrogen-Ready Infrastructure: All new European terminals required to accommodate hydrogen injection
Predictive Maintenance: AI-driven maintenance reduces unplanned downtime by 40%
Demand Forecasting: Machine learning improves forecast accuracy by 25%
Blockchain Tracking: Supply chain transparency for carbon credits and regulatory compliance
East Africa: Mozambique LNG (12.8 Mt/year) and Tanzania LNG (10 Mt/year) coming online by 2028
Canada: Kitimat LNG (14 Mt/year) and Goldboro LNG (10 Mt/year) targeting Asian markets
Russia Far East: New Arctic LNG projects serving Asian markets via Northern Sea Route
liquefied-natural-gas-plant liquefied-natural-gas-export-terminals liquefaction-plant-lng liquefied-natural-gas-price
| Metric | 2024 | 2026 | 2030 | CAGR |
|---|---|---|---|---|
| Global Demand (Mt) | 410 | 520 | 720 | 8.5% |
| Spot Market Share (%) | 22% | 28% | 35% | +6pp |
| Low-Carbon LNG Share (%) | 2% | 8% | 25% | +17pp |
| Average Price ($/MMBtu) | $10.20 | $8.50 | $7.20 | -1.5% CAGR |
Qatar and Australia are considered the most reliable for long-term contracts due to:
Key differences in US vs Middle Eastern LNG:
| Factor | United States | Qatar | Saudi Arabia/UAE |
|---|---|---|---|
| Production Cost | $2.50-$3.50/MMBtu | $1.50-$2.20/MMBtu | $3.00-$4.00/MMBtu |
| Contract Terms | Spot + short-term (60% spot market share) | Long-term SPAs (95% contracted) | Government-controlled pricing |
| Logistics Cost | $1.20-$2.50/MMBtu (longer shipping) | $0.80-$1.50/MMBtu (shorter to Asia) | $1.50-$2.80/MMBtu |
| Regulatory Compliance | EPA methane standards; DOE export approvals | QatarEnergy standards | Emirates/ADNOC standards |
Environmental factors vary significantly by country of origin:
EU REPowerEU Standards (effective 2026):
Geopolitical risk mitigation strategies:
Current Risk Ratings (2026):
LNG specifications vary by regional requirements:
| Parameter | Asian Specification | European Specification | US Specification |
|---|---|---|---|
| Methane Content (%) | 92-94% | 95-98% | 95%+ |
| BTU Content (kWh/m³) | 11.5-12.5 | 12.5-13.5 | 13.0+ |
| Nitrogen Content (%) | <0.5% | <0.3% | <0.2% |
| H₂S Content (ppm) | <3.5 | <4 | <5 |
| Wobbe Index | 48-52 MJ/m³ | 50-54 MJ/m³ | 52-55 MJ/m³ |
Implications:
Comparison of Spot vs Long-Term LNG Procurement:
| Factor | Spot Market Purchases | Long-Term Contracts |
|---|---|---|
| Price Volatility | High (linked to JKM/TTF) | Low (fixed formulas) |
| Volume Flexibility | 100% (call options available) | 70-90% (take-or-pay clauses) |
| Lead Time | 1-3 months | 2-5 years |
| Logistics Arrangement | Buyer's responsibility | Supplier's responsibility (CIF) |
| Typical Buyer Profile | Traders, flexible consumers | Industrial users, utilities |
| Cost Structure | Market-based + premiums | Formula-based (JCC/Brent + fixed premium) |
Recommended Mix for 2026:
Essential LNG Certifications:
Third-Party Verification: Buyers should require:
SME Access Strategies:
Why Choose Shijiazhuang Enric Gas Equipment for Your LNG Procurement:
🚀 Limited-Time Offer: First-time buyers receive:
Bowen Di
📞 +86 15614368118
📱 WhatsApp: +86 18132059236

We stand behind our LNG supply with:
⚠️ Limited Availability: 2026 LNG supply is already 60% contracted. Secure your allocation before capacity fills up.

"We reduced our LNG costs by 22% while improving supply security by diversifying from Russia to Nigerian LNG. The technical support from Shijiazhuang Enric was instrumental in navigating EU compliance requirements."
— Klaus Schmidt, Procurement Director

"The spot market access through Shijiazhuang Enric gave us the flexibility to capitalize on price volatility. Their real-time market intelligence saved us $2.3 million in Q1 2025 alone."
— Priya Patel, Trading Manager

"We needed reliable LNG supply for our new facility. Shijiazhuang Enric delivered 99.8% uptime and helped us navigate Texas regulatory requirements. Their Henry Hub-linked pricing gave us cost predictability."
— Michael Chen, Operations Manager

"As a domestic buyer, we needed both supply reliability and price stability. Shijiazhuang Enric's Nigeria LNG contracts gave us 20% cost savings compared to international benchmarks while supporting local industry."
— Amina Ibrahim, CEO

Li Wei Zhang is a senior LNG industry expert with 23 years of experience in global energy markets. As former Regional Manager for Shell LNG Trading and current Senior Advisor to Shijiazhuang Enric Gas Equipment, Li has advised Fortune 500 companies on LNG procurement strategies across 40+ countries.
Li holds an MBA from Tsinghua University and is a certified energy risk management professional. His expertise includes:
Li has been quoted in Bloomberg Energy, Financial Times, and Energy Intelligence and has presented at CERAWeek, Gastech, and LNG2025 conferences.
Shijiazhuang Enric Gas Equipment Co., Ltd. complies with all international data protection regulations including GDPR (EU), CCPA (US), and China's Cybersecurity Law. Your information is:
-Hengkai Natural Gas Liquefaction Project
-Changming Phase II Natural Gas Liquefaction Project
-Hwange Natural Gas Liquefaction Project
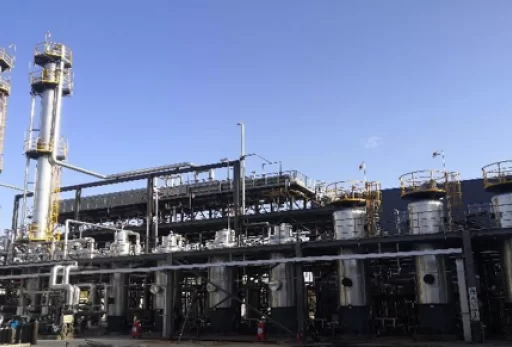
-Tianhao Coalbed Methane Liquefaction Project
-Tianyun Coalbed Methane Liquefaction Project
-Shuntai Coalbed Methane Liquefaction Project
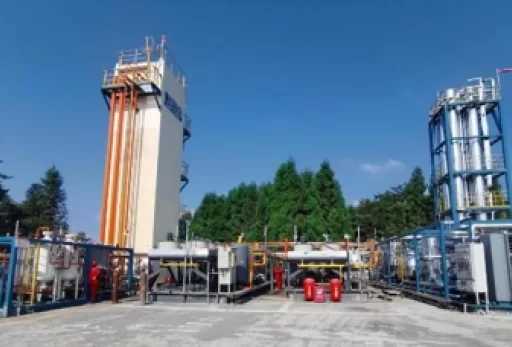
-60.000 cubic meters/day
-60.000 cubic meters/day
-60.000 m3/day*2 sets
-200.000 cubic meters/day




 Contact Jeremy Wu (North America)

Trusted by Industry Leaders Worldwide
Our LNG sourcing solutions power operations across 40+ countries and serve clients in chemicals, power generation, manufacturing, and transportation sectors.
Global Certifications & Compliance:
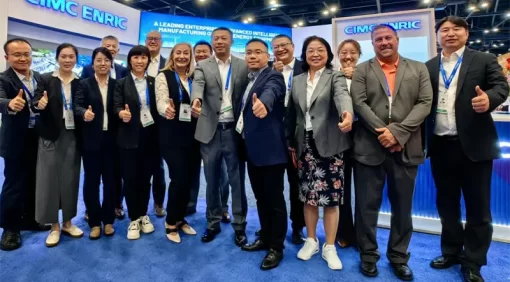
Customer Support in Action: